Gnuplot Tricks for OpenFOAM
Table of Contents
1. Plotting residuals
For steady state simulations I recommend using the pyFoamPlotWatcher command to get nice residual plots.
For unsteady simulations using the PIMPLE algorithm, however, these won’t give you the same type of residual plots that you will be used to in Fluent.
We want to reproduce these using gnuplot and we want to have them auto-update while the case is running, so let’s see how we can achieve this.
1.1. Logfile format
The logfile that we have looks like this:
PIMPLE: iteration 1
smoothSolver:  Solving for Ux, Initial residual = 0.0657515, Final residual = 0.00295575, No Iterations 1
smoothSolver:  Solving for Uy, Initial residual = 0.0567547, Final residual = 0.00257969, No Iterations 1
smoothSolver:  Solving for Uz, Initial residual = 0.249962, Final residual = 0.0111677, No Iterations 1
GAMG:  Solving for p, Initial residual = 0.999938, Final residual = 0.00386231, No Iterations 8
GAMG:  Solving for p, Initial residual = 0.0829969, Final residual = 0.000331819, No Iterations 4
GAMG:  Solving for p, Initial residual = 0.0172877, Final residual = 0.000116947, No Iterations 5
time step continuity errors : sum local = 1.00321e-07, global = -3.09809e-10, cumulative = -3.09809e-10
GAMG:  Solving for p, Initial residual = 0.0599606, Final residual = 0.000195626, No Iterations 8
GAMG:  Solving for p, Initial residual = 0.0524162, Final residual = 0.000229763, No Iterations 4
GAMG:  Solving for p, Initial residual = 0.0115324, Final residual = 7.6718e-05, No Iterations 5
time step continuity errors : sum local = 5.67009e-08, global = -2.02691e-10, cumulative = -5.125e-10
Not Solving for H, Migration Model is inactive 1
1.2. Filtering and Plotting the Residuals:
That looks quite readable, so if we want to get the residual for Ux, then we can filter that using grep on the logfile (replace logfile with the name of your logfile):
grep -e 'Solving for Ux' logfile | head -n 10
smoothSolver:  Solving for Ux, Initial residual = 0.0657515, Final residual = 0.00295575, No Iterations 1
smoothSolver:  Solving for Ux, Initial residual = 0.0443479, Final residual = 0.00347216, No Iterations 1
smoothSolver:  Solving for Ux, Initial residual = 0.033049, Final residual = 0.000554315, No Iterations 2
smoothSolver:  Solving for Ux, Initial residual = 0.0248192, Final residual = 0.00050135, No Iterations 2
smoothSolver:  Solving for Ux, Initial residual = 0.0182557, Final residual = 0.000390825, No Iterations 2
smoothSolver:  Solving for Ux, Initial residual = 0.0137072, Final residual = 0.000306506, No Iterations 2
smoothSolver:  Solving for Ux, Initial residual = 0.011255, Final residual = 0.000266348, No Iterations 2
smoothSolver:  Solving for Ux, Initial residual = 0.00992755, Final residual = 0.000245824, No Iterations 2
smoothSolver:  Solving for Ux, Initial residual = 0.00898181, Final residual = 0.000231707, No Iterations 2
smoothSolver:  Solving for Ux, Initial residual = 0.00826049, Final residual = 0.000219721, No Iterations 2
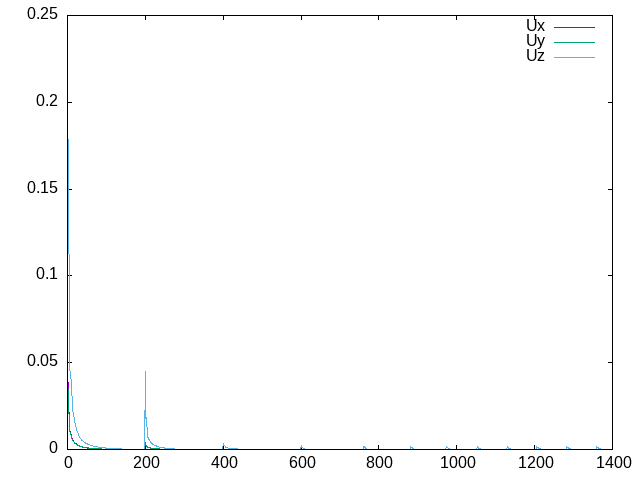
Whitespace is seen as table separator, so the initial residual is in the 8th column. We can tell gnuplot to plot this using:
reset
plot "<grep -e 'Solving for Ux' logfile" u 8 w l title "Ux", \
     "<grep -e 'Solving for Uy' logfile" u 8 w l title "Uy", \
     "<grep -e 'Solving for Uz' logfile" u 8 w l title "Uz"
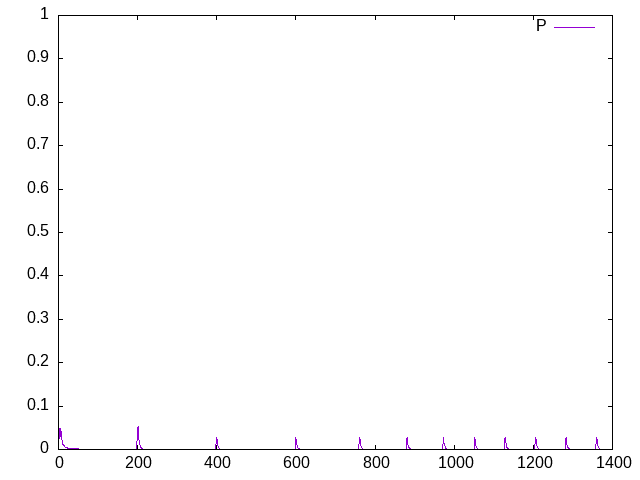
For pressure the command is slightly more complicated, since the pressure is solved multiple times per iteration (correctors * nonorthogonal correctors). So if, e.g., we have 3 correctors and 2 non-orthogonal correctors, then the pressure is solved 6 times. We only want to plot every 6th line, then.
We can use the awk command for that and pipe the output of grep into an awk command that filters every 6th line (replace the 6 with the correct number for your setup.)
plot "<grep -e 'Solving for p' logfile | awk '{if(NR%6==1) print $0}'" u 8 w l title "P"
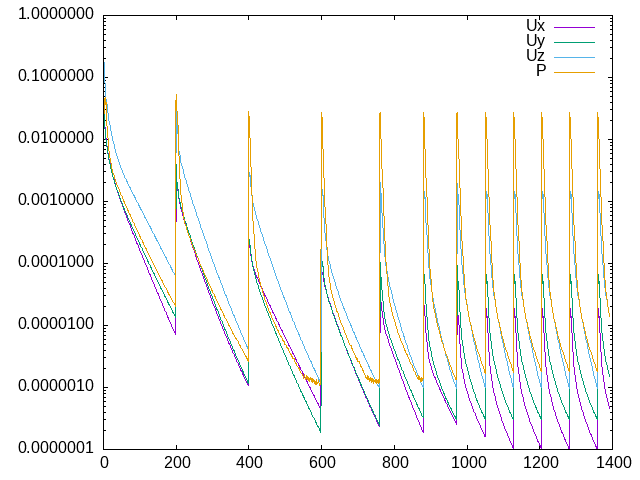
1.3. Logarithmic y-scale
Typically residuals are plotted on a logarithmic scale. This is easy to achieve:
set logscale y
1.4. The final script
set logscale y
plot "<grep -e 'Solving for Ux' logfile" u 8 w l title "Ux", \
     "<grep -e 'Solving for Uy' logfile" u 8 w l title "Uy", \
     "<grep -e 'Solving for Uz' logfile" u 8 w l title "Uz", \
     "<grep -e 'Solving for p' logfile | awk '{if(NR%6==1) print $0}'" u 8 w l title "P"
1.5. Automatic replotting
If you want to keep an eye on the residuals, while the simulation is running, you can do a quick loop like this:
while (1) {
  reset
  set logscale y
  replot
  pause 10
}
This will replot the above every 10 seconds.